10 REST for Label Layers
A label layer overlays text from a selected source onto an underlying map, positioning the text to label specified geometries (e.g. U.S. states, cities, roads, etc.).
Since a label layer is typically used to identify features of another layer, the following steps illustrate how to create a map with a both a label layer and a simple layer, in this case using a Mapfluence dataset that identifies the boundaries of areas that NOAA has defined as climate divisions:
1. Start with the host, version, API key, and endpoint:
http://query.mapfluence.com/2.0/MFDOCS/map
2. Add the layer definition for the simple layer, separating each property value pair with a pipe:
- mode=simple: the layer type, in this case simple.
- from=umi.noaa_boundaries.climate_division_geometry: the source of the geometries that will be overlaid, which in this case are the NOAA Climate Division Boundaries geometries that we are going to label.
- border=802020_1: the color (in this case a dark red) and line weight of the border, which shows the boundaries between climate divisions.
- style=00000000: the color and transparency, stated as RGBA expressed in hex, that will be used to render the geometries. In this case, since the last two digits are 00, the alpha channel is set to fully transparent (geometries are rendered as clear) and the first six digits don't have any effect as long as they represent a valid HTML hex color.
Note: In a simple layer, style is singular.
/mode=simple|umi.noaa_boundaries.climate_division_geometry|border=802020_1|style=00000000
3. Add the layer definition for the label layer, which means specifying the values of the required layer properties, separating each property value pair with a pipe. We specify the label layer first because we want it rendered on top of the simple layer.
Note: The optional opacity property is not specified because default opacity is 1 (full) which is what one might typically want for labels:
- mode=label: the layer type, in this case label.
- select=name: the source of the label data, in this case the name column (with display name of "Division Name") of the NOAA Climate Division Boundaries attribute table in the Climate Division Boundaries dataset.
- from=umi.noaa_boundaries.climate_division_geometry: the source of the geometries over which each label will be overlaid, which is the geometry table in the Climate Division Boundaries dataset.
- face_name=FreeSans Bold: the name of the font face to use for the labels. The default font face for labels is DejaVu Sans Book. An alternative face may be chosen from the list of available fonts at http://query.mapfluence.com/2.0/fonts.html.
- size=16: the font size.
- fill=a02828: the color of the label (in this case a medium red), stated as a valid HTML RGB hex expression.
/mode=label|select=name|from=umi.noaa_boundaries.climate_division_geometry|face_name=FreeSans Bold|size=16|fill=a02828
4. Add the base map code (in this case for Google Maps) after the last layer definition:
/g
5. Add a query string after the base map code to specify the map's centerpoint, size, and zoom, which we use in this case to focus the map on Florida:
?lat=27.7&lng=-83.52&width=760&height=720&zoom=7
6. Put it all together and you have the complete REST path for the map:
http://query.mapfluence.com/2.0/MFDOCS/map/mode=simple|umi.noaa_boundaries.climate_division_geometry|border=802020_1|style=00000000/mode=label|select=name|from=umi.noaa_boundaries.climate_division_geometry|face_name=FreeSans Bold|size=16|fill=a02828/g/?lat=27.7&lng=-83.52&width=760&height=720&zoom=7
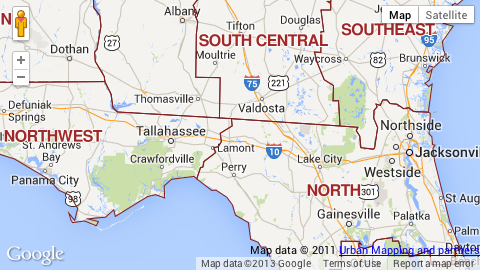
Here's an excerpt of the map, showing NOAA climate divisions in the American Southeast, that is returned from the above URL (to see the full map in a new window, click here):
Note: For complete details on the purpose and valid values of label layer properties, both required and optional, refer to the Label Layer page of the Mapfluence REST API Reference at http://developer.urbanmapping.com/docs/mapfluence/rest/2.0/reference/tile/layer/Label.
Top