Not surprisingly, the simplest type of Mapfluence layer is the simple layer, which displays the geometries (points, lines, or polygons) of features along with, optionally, the boundaries of those geometries.
Simple layers are referred to as simple because all geometries that meet the criteria for inclusion in the layer are displayed the same way. A map showing all census designated places (population concentrations as defined by the U.S. Census Bureau), for example, might use a simple layer in which all CDPs are indicated with the same color and opacity, and all boundaries between CDPs are indicated with lines of the same color and weight.
In the following sections we'll use Mapfluence REST to create maps with two different kinds of simple layers:
| 6.1 Simple Polygonal Layer | go: top |
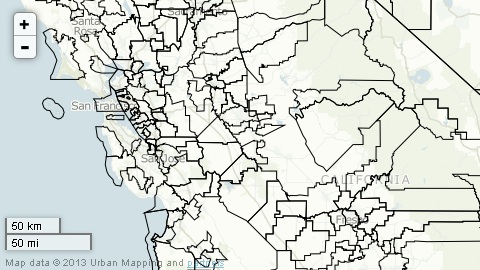
One common simple layer type displays polygonal geometries, such as cities or counties. Let's build the path for a map with a base layer and one simple layer overlay that shows polygonal geometries, in this case school district boundaries:
1. Start with the host, version, API key, and endpoint:
http://query.mapfluence.com/2.0/MFDOCS/map
2. Add the layer definition, which means specifying the values of the required layer properties, separating each property value pair with a pipe:
- mode=simple: the layer type, in this case simple.
- from=us_schl_dists.uni2008_geom: the source of the geometries that will be overlaid, which is the geometry table (uni2008_geom) in the Mapfluence dataset covering U.S. school districts.
- border=black_1: the color and line weight of the border, which shows the boundaries between districts.
- style=00000000: the color and transparency, stated as RGBA expressed in hex, that will be used to render the geometries. In this case, since the last two digits are 00, the alpha channel is set to fully transparent (geometries are rendered as clear) and the first six digits don't have any effect as long as they represent a valid HTML hex color.
Note: In a simple layer, style is singular.
/mode=simple|from=umi.us_schl_dists.unified_geometry|border=black_1|style=00000000
3. We'll also add a query string after the base map code to specify the centerpoint coordinates (lat for latitude, lng for longitude) and the zoom:
/?lat=37.5&lng=-120&zoom=7
4. Put it all together and you have the complete REST path that Mapfluence will use to build the specified map and return a rendered tile to the requesting client:
http://query.mapfluence.com/2.0/MFDOCS/map/mode=simple|from=umi.us_schl_dists.unified_geometry|border=black_1|style=00000000/?lat=37.5&lng=-120&zoom=7
Here's an excerpt of the map, showing school district boundaries, that is returned from the above URL (to see the full map in a new window, click here):
| 6.2 Simple Point Layer | go: top |
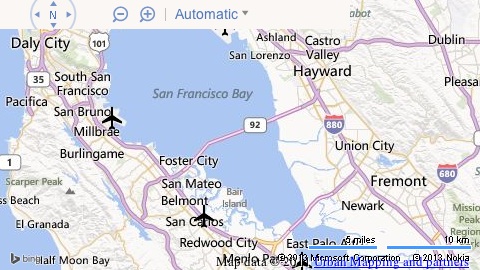
Another common simple layer type displays features as points at a specific location. Now let's build the path for a map with a base layer and one simple layer overlay that shows features, in this case airports, as points. The airports will be indicated with an icon that we'll specify from the set of available Mapfluence icons at . We'll also use the query string to set the centerpoint, size, and zoom of the map we want returned:
1. Start with the host, version, API key, and endpoint:
http://query.mapfluence.com/2.0/MFDOCS/map
2. Add the layer definition, which means specifying the values of the required layer properties, separating each property value pair with a pipe:
- mode=simple: the layer type, in this case simple.
- from=umi.ntad_airports.geometry: the source of the geometries that will be overlaid, which is the geometry table (arpt_loc_geom) in the Mapfluence dataset covering U.S. airports.
- style=icon_air_transportation_24x20: the Mapfluence icon, in this case an airplane, that will be overlaid to indicate the location of each airport. The icon dimensions are specified in pixels (horizontal × vertical) after an underscore.
Note: In a simple layer, style is singular.
/mode=simple|from=umi.ntad_airports.geometry|style=icon_air_transportation_24x20
3. This time, instead of using the default Mapfluence maps we'll add a base map code for Bing Maps after the layer definition:
/b
4. As before, we'll add a query string after the base map code to specify the centerpoint coordinates (lat for latitude, lng for longitude) and the zoom, but this time we'll also specify the desired size of the returned map (width, height),:
/?lat=37.6&lng=-122.2&zoom=10&width=640&height=480
5. Put it all together and you have the complete REST path for the map:
http://query.mapfluence.com/2.0/MFDOCS/map/mode=simple|from=umi.ntad_airports.geometry|style=icon_air_transportation_24x20/b/?lat=37.6&lng=-122.2&zoom=10&width=640&height=480
Here's an excerpt of the map, showing airport locations, that is returned from the above URL (to see the full map in a new window, click here):
Notes:
» For complete details on the purpose and valid values of simple layer properties, both required and optional, refer to the Simple Layer page of the Mapfluence REST API Reference at http://developer.urbanmapping.com/docs/mapfluence/rest/2.0/reference/tile/layer/Simple.
» A list of available icons, as well as instructions on their use, can be found in Mapfluence API Icons at http://tile.mapfluence.com/2.0/icons.html.
» The properties max_zoom and min_zoom may be used to define different display characteristics for a point (e.g. size in pixels) depending on the current zoom of the map.