9 REST for Heatmap Layers
A heatmap layer displays ranges of point density (location of selected type of event or feature), with different density ranges displayed using different color gradients. The number of ranges and the color gradient within each range are both derived from the number of color values specified with the colors property.
To determine the ranges and gradients, first the point density information is rounded to a scale of 0-255. Next the number of colors specified in the colors property is evaluated to determine the number of density ranges, with each consecutive color value pair in the colors string defining one range. If, for example, there are five colors values there would be four ranges (range 1 for values 1-2, 2 for 2-3, 3 for 3-4, and 4 for 4-5). The densities are then divided between these density ranges (densities 0-63 to density range 1, 64-127 to 2, 128-191 to 3, 192-255 to 4). Then each range is assigned a color gradient such that the densities in each range are represented by a gradient between the corresponding pairs of colors in the colors property (the gradient for density range 1 being between color 1 and color 2, for density range 2 being between color 2 and color 3, etc.).
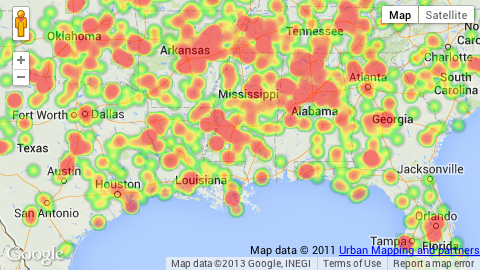
The following steps illustrate how to create a heatmap layer, in this case using data from the Mapfluence data catalog on the concentration of fatalities from tornado touchdowns:
1. Start with the host, version, API key, and endpoint:
http://query.mapfluence.com/2.0/MFDOCS/map
2. Add the layer definition, which means specifying the values of the required layer properties, separating each property value pair with a pipe:
- mode=heatmap: the layer type, in this case heatmap.
- select=umi.noaa_tornado.attributes.num_fatal: the source of the event data from which point density is derived, in this case an attribute table from NOAA containing tornado touchdown fatalities.
- from=umi.noaa_tornado.geometry: the source of the point geometries that will be overlaid, which is a geometry table in the NOAA dataset.
- colors=00000000,00ff00,ffff00,ff8000,ff0000: a list of valid HTML color values. The first is hex RGBA, with the alpha channel given as 00 to specify full transparency. The remaining colors are standard hex RGB.
- opacity=0.5: the overall opacity of the layer. This is an alternative to adding an alpha channel specification to the end of each color in the colors property.
/mode=heatmap|select=umi.noaa_tornado.attributes.num_fatal|from=umi.noaa_tornado.geometry|colors=00000000,00ff00,ffff00,ff8000,ff0000|opacity=0.5
3. Add the base map code (in this case for Google Maps) after the layer definition:
/g
4. Add a query string after the base map code to specify the map's centerpoint, size, and zoom:
/?lat=38&lng=-90&width=720&height=640&zoom=5
5. Put it all together and you have the complete REST path for the map:
http://query.mapfluence.com/2.0/MFDOCS/map/mode=heatmap|select=umi.noaa_tornado.attributes.num_fatal|from=umi.noaa_tornado.geometry|colors=00000000,00ff00,ffff00,ff8000,ff0000|opacity=0.5/g/?lat=38&lng=-90&width=720&height=640&zoom=5
Here's an excerpt of the map, showing the concentration of fatalities from tornado touchdowns, that is returned from the above URL (to see the full map in a new window, click here):
Note: For complete details on the purpose and valid values of heatmap layer properties, both required and optional, refer to the Heatmap Layer page of the Mapfluence REST API Reference at http://developer.urbanmapping.com/docs/mapfluence/rest/2.0/reference/tile/layer/Heatmap.
Top